

 082 069 9955
 @envisiontech
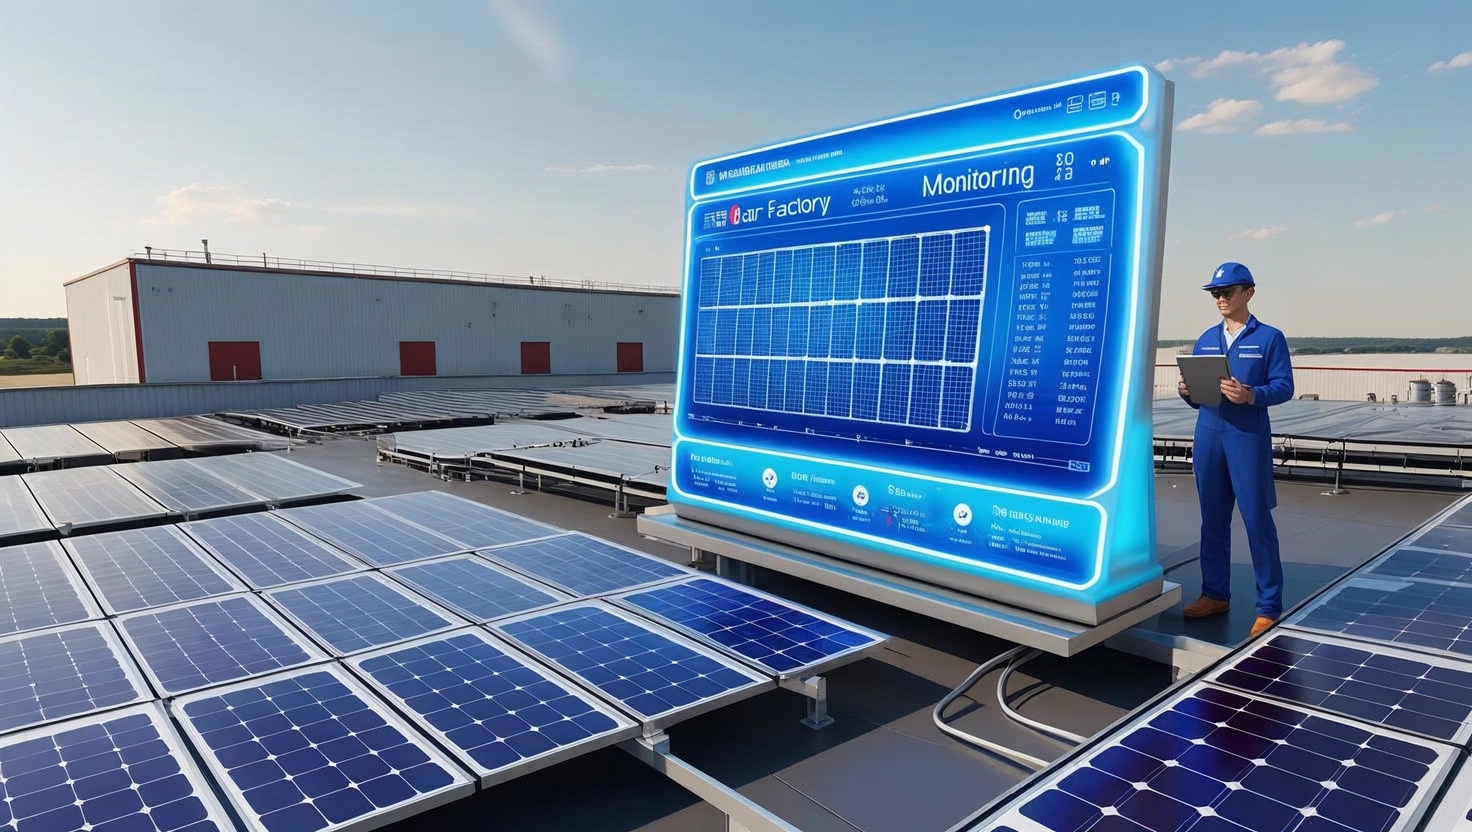
We have design and developed the customized Windows
application program with the following functions.
1.Real-time data display (Overview Home Page)
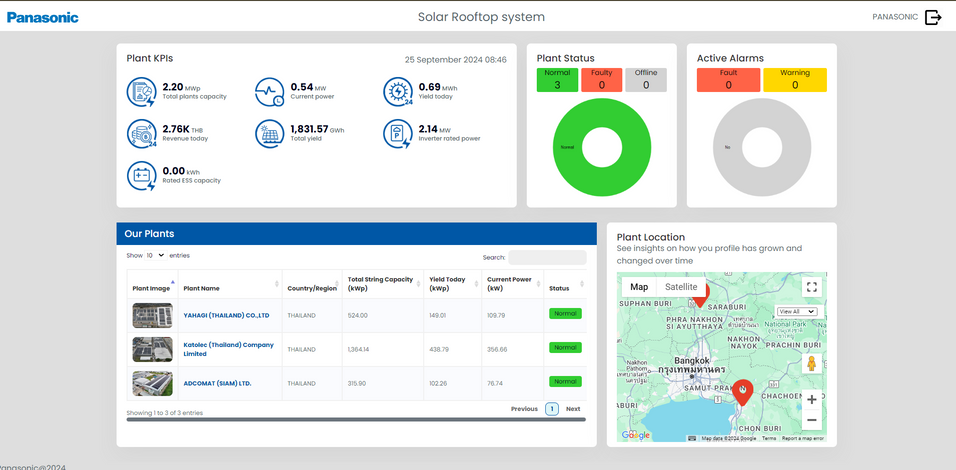
a. Inverter Power
b. Irradiation both horizontal and plane orientation
c. Ambient temperature
d. Module temperature
e. PQ Meter
- i.Export energy in kWh
- ii. Import energy in kWh
- iii. Export energy in kVAR
- iv. Import energy in kVAR
- v. AC power in kW
- vi. AC power in kVAR
- vii. AC power in kVA
- viii. Frequency
- ix. Power factor
- x. Voltage A-B
- xi. Voltage C-B
- xii. Voltage C-A
- xiii. Current A
- xiv. Current B
- xv. Current C
f. DC power in kWh in each hour and total (Value and graph)
g. AC power in kWh in each hour and total (Value and graph)
h. Average irradiation (Value and graph)
i. Average ambient temperature (Value and graph)
j. Average module temperature (Value and graph)
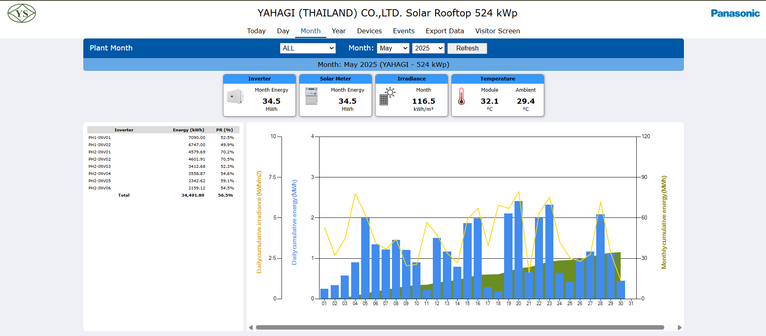
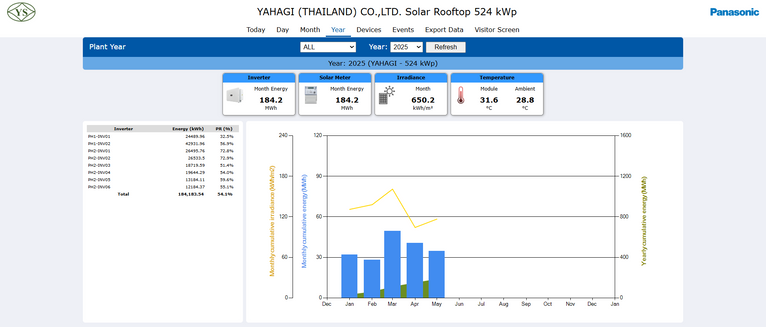
2.Energy Balance (Today, Day, Month, Year)
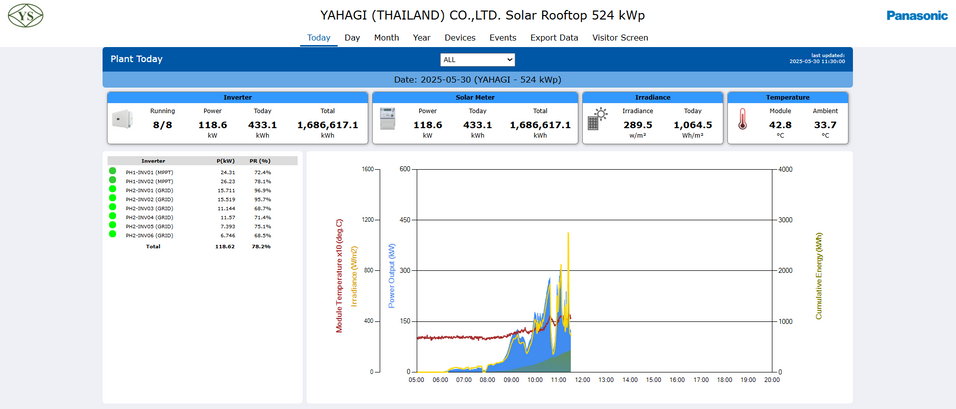
a. Real-time power of each energy consumption in value and bar graph
b. Daily, Monthly and Yearly data can be generated and Viewed (Value and graph
3.Devices Info :
3.1 Huawei Inverter 50 KTL 17 EA (67 Strings)
3.2 Grid Meter 1 EA
3.3 Sensor : IRR, PV, AMB, WIND
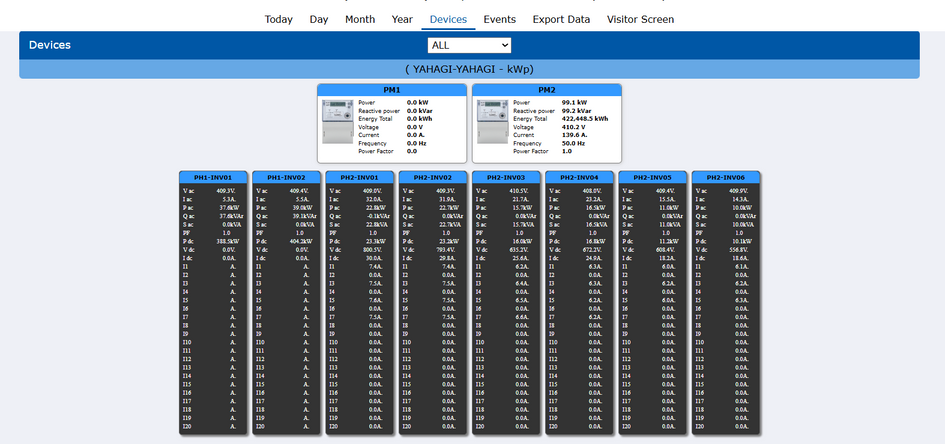
a. Real-time power of each inverter and PV String in value
b. Inverter status (OK, Warning, Fault)
c. Real-time-display the AC frequency of the inverter separated into phases.
Plant parameters are collected every 1 minutes and the report can be generated on
daily basis. Below are the parameters that are collected and show in the Display.
Voltage (DC & AC)
- Current of each line
- Frequency
- Power factor
- Power output in kW, kVAR, and kVA
- Energy output
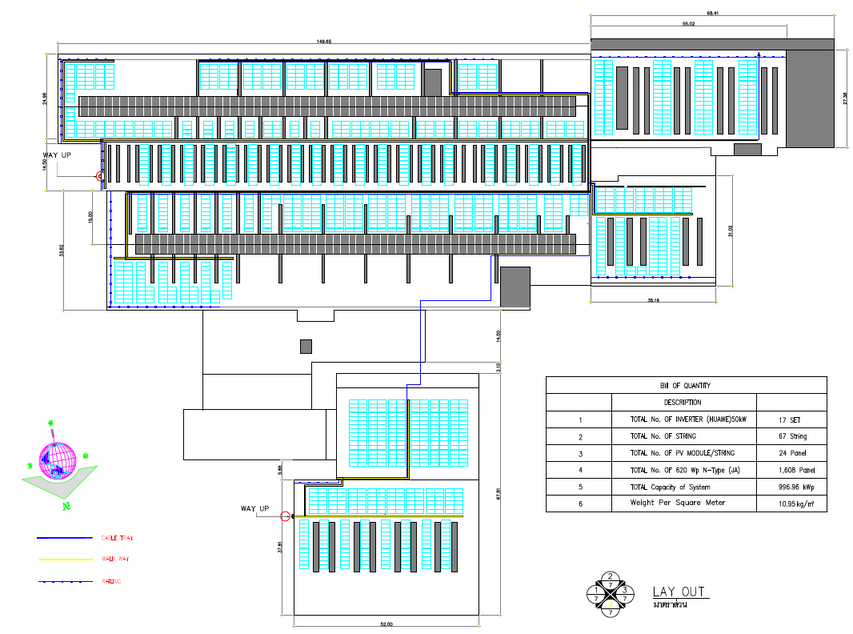
String Layout : Status , Alarm Notification
Alarm in case of below 90% AVG String Power Generated
5.Event : Alarm Report, Data Log

Event Log can be generated and printed in the Export Data tab.
6.Export Data
Daily and Monthly Report can be generated and printed in the Export Data tab.
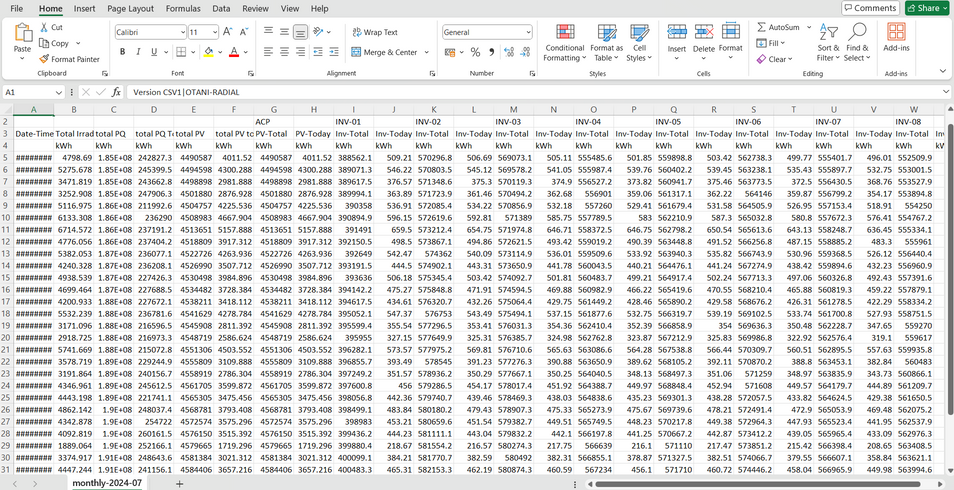
Data can be generated in the form of Microsoft Excel
Plant parameters are collected every 1 minutes and the report can be generated on
daily basis. Below are the parameters that are collected and show in the report.
- Voltage (line to line)
- Current of each line
- Frequency
- Power factor
- Power output in kW, kVAR, and kVA
- Energy output
- Irradiation
The program can be configured on this page as follows.
a. Plant setting
i. Plant name
ii. Project name
iii. Project description
iv. Plant capacity
v. Title icon file
vi. Diagram picture file
viii. Plant location
b. Device setting
i. PV module’s manufacturer
ii. PV module’s model
iii. PV module’s quantity
iv. PV module’s area
v. Inverter’s manufacturer
vi. Inverter’s model
vii. Inverter’s quantity
viii. Inverter’s power
ix. Performance Ratio
x. Weighted ratio of each
irradiation sensor
c. Record setting
i. Recording time (interval)
ii.Record data folder
iii. CSV export folder
iv. PQ IP and port
7.Visitor Screen
Below are the parameters that are collected and show in the Visitor Screen.
- Plant Capacity
- Yield Today
- Total Yield Energy
- Power Flow Animation
- Grid Power
- Load Power
- PV Power
- Temperature
- Report Graph
- Plat Layout Picture
- Environmental Benefi
- Environmental Benefits
- CO2 Emission Saved
- Tree Planted
- Site Details
- Alarts




 082 069 9955
 envisiontechgroup


